Recently I’ve watched a video showing how to draw an approximation of the Sierpiński triangle on paper using the following steps1:
- Plot three points to form an equilateral triangle
- Randomly select any point inside the triangle and consider that your current position
- Randomly select any of the triangle’s vertices
- Move half the distance from your current position to the selected vertex
- Plot the current position
- Go to step 3
I found it absolutely fascinating, and at the same time I was extremely skeptical. My mind couldn’t comprehend how following those simple steps could possibly yield this magnificent shape:
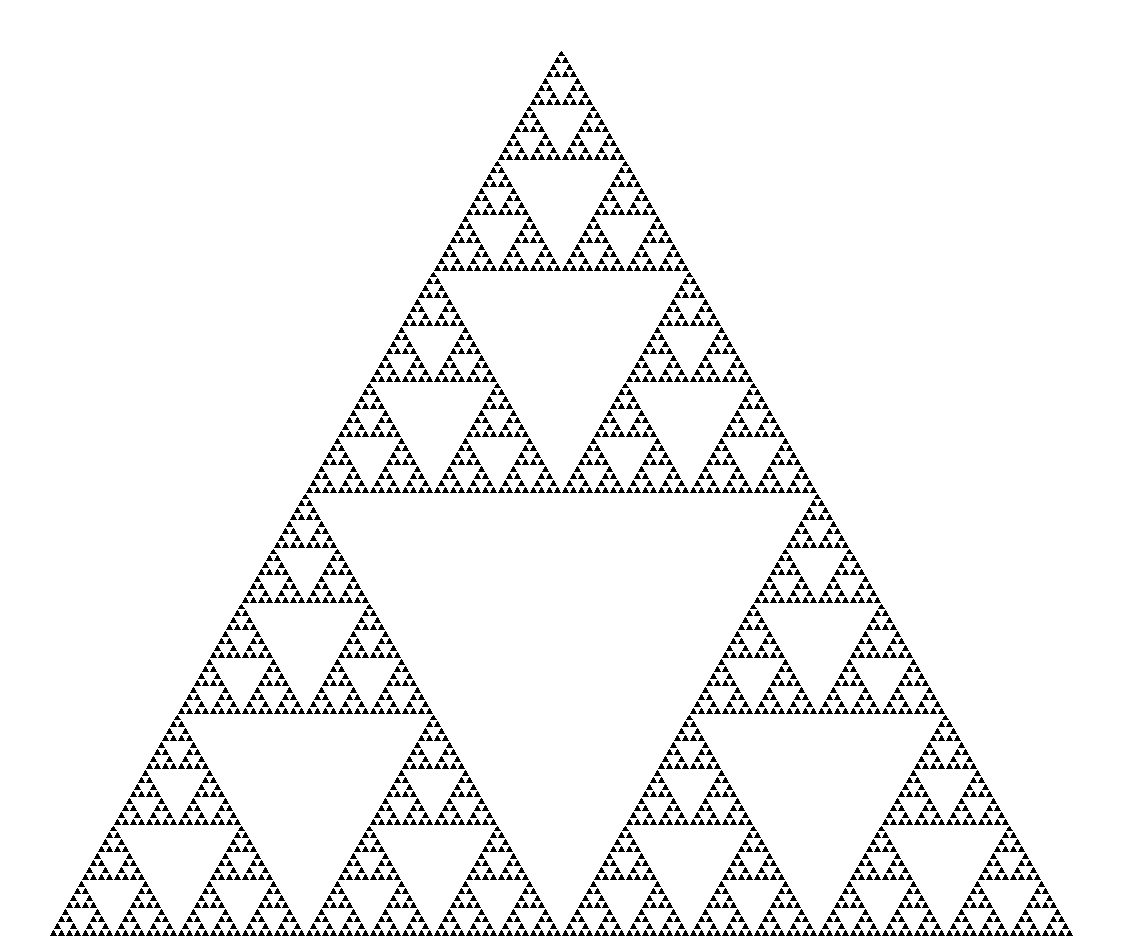
|
|---|
| The Sierpiński triangle 2 |
Therefore, naturally, I had the overwhelming urge to write some code to verify the outcome of the video that I’d just watched.
So here goes:
<!-- index.html -->

<!DOCTYPE html>
<html>
  <head>
    <title>The Sierpiński triangle</title>
    <meta charset="UTF-8" />
  </head>

  <body style="background-color: black;">
    <canvas id="canvas" width="800" height="800"></canvas>
    <script src="index.js"></script>
  </body>
</html>
// index.js

(async function () {
  // Capture canvas element.
  const canvas = document.querySelector("#canvas");
  if (!canvas.getContext) {
    return;
  }

  // Capture canvas's 2D rendering context.
  const canvasContext = canvas.getContext("2d");
  const { width: canvasWidth, height: canvasHeight } = canvas;

  // Configure canvas's context.
  canvasContext.font = "30px monospace";
  canvasContext.fillStyle = "white";

  // Define the coordinates of the triangle's vertices.
  const lowerLeftVertex = { x: 0, y: canvasHeight };
  const lowerRightVertex = { x: canvasWidth, y: canvasHeight };
  const topVertex = { x: canvasWidth / 2, y: 0 };

  const vertices = [lowerLeftVertex, lowerRightVertex, topVertex];
  const midpoints = [];

  // Plot the triangle's vertices.
  vertices.forEach(drawPoint(canvasContext));

  // Repeat 20 thousand times.
  for (let i = 0; i < 20_000; i++) {
    // Select a vertex at random.
    const randomVertex = getRandomElement(vertices);
    // Get the last midpoint.
    const lastMidpoint =
      midpoints[midpoints.length - 1] ?? getRandomElement(vertices);

    // Compute the midpoint between the randomly selected vertex and the last
    // midpoint from the previous iteration (i.e. current position).
    const newMidpoint = computeMidpoint(randomVertex, lastMidpoint);
    midpoints.push(newMidpoint);

    // Draw the newly computed midpoint.
    drawPoint(canvasContext)(newMidpoint);
    // Re-render iteration count.
    updateIterationCount(canvasContext)(i);

    // Sleep for 1 millisecond to plot the points incrementally and not all at
    // once.
    await sleep(1);
  }
})();

function drawPoint(canvasContext) {
  return function (coordinates, size = 1) {
    const { x, y } = coordinates;

    canvasContext.beginPath();
    canvasContext.arc(x, y, size, 0, Math.PI * 2, true);
    canvasContext.fill();
  };
}

function updateIterationCount(canvasContext) {
  return function (i) {
    canvasContext.clearRect(0, 0, 200, 50);
    canvasContext.fillText(i, 0, 30);
  };
}

function getRandomElement(list) {
  const randomIndex = Math.floor(Math.random() * list.length);
  return list[randomIndex];
}

function computeMidpoint(firstPoint, secondPoint) {
  return {
    x: Math.floor(Math.abs((firstPoint.x + secondPoint.x) / 2)),
    y: Math.floor(Math.abs((firstPoint.y + secondPoint.y) / 2)),
  };
}

function sleep(millis) {
  return new Promise(function (resolve) {
    setTimeout(resolve, millis);
  });
}
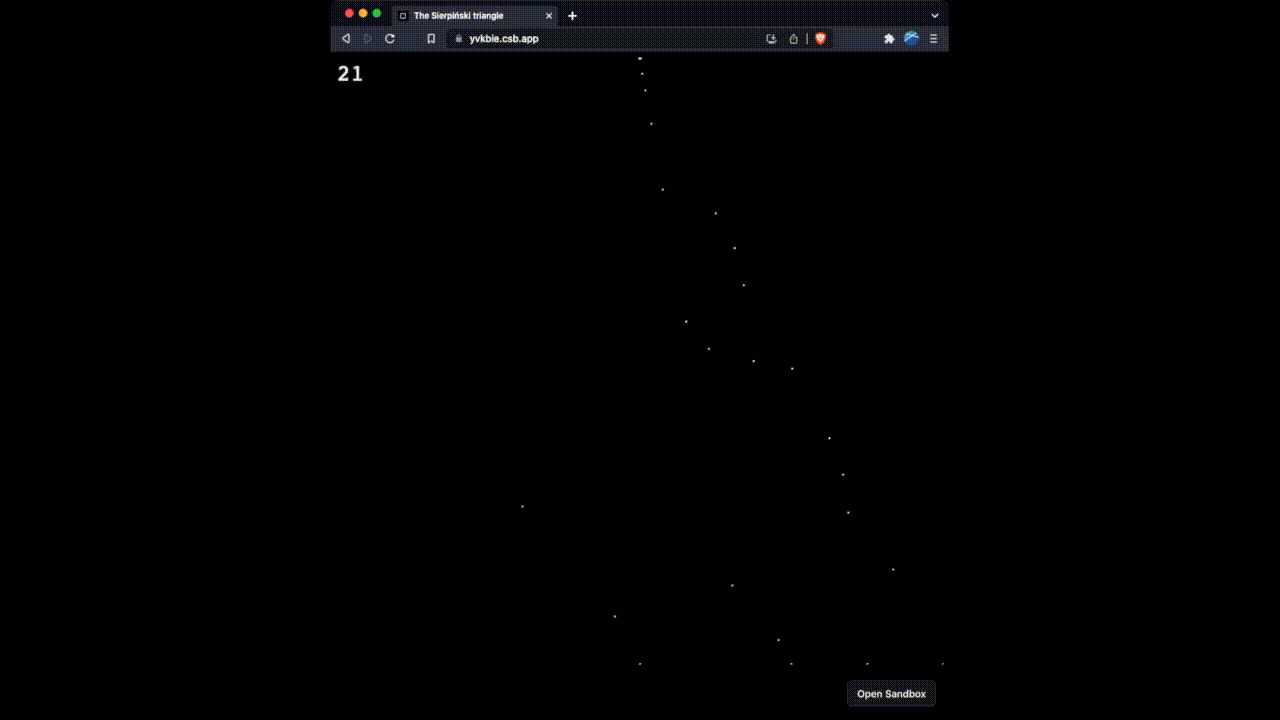
And sure enough, it produces the promised result: